Intelligence Navigator
Get essential business insights.
Everything you need for business intelligence, analytics automation, and customer intelligence — one platform for technical and non-technical teams, no code required.
Free forever · No credit card required · Paid plans from $23.99/month
Connect to Apps Built for Business
How it works
From scattered data to decisions — without a BI team.
- 1
Connect your data
Upload spreadsheets or connect CRM, finance, and ops tools — the same files and systems your business already runs on.
- 2
Run the analysis you need
Use dedicated modules for trends, KPIs, forecasts, sentiment, competitor intel, customer 360, and pricing — guided workflows with AI-written insights on every result.
- 3
Share outcomes that stick
Pin results to live dashboards, assemble reports and board decks, and optionally add agentic AI for plain-English Q&A or scheduled delivery.
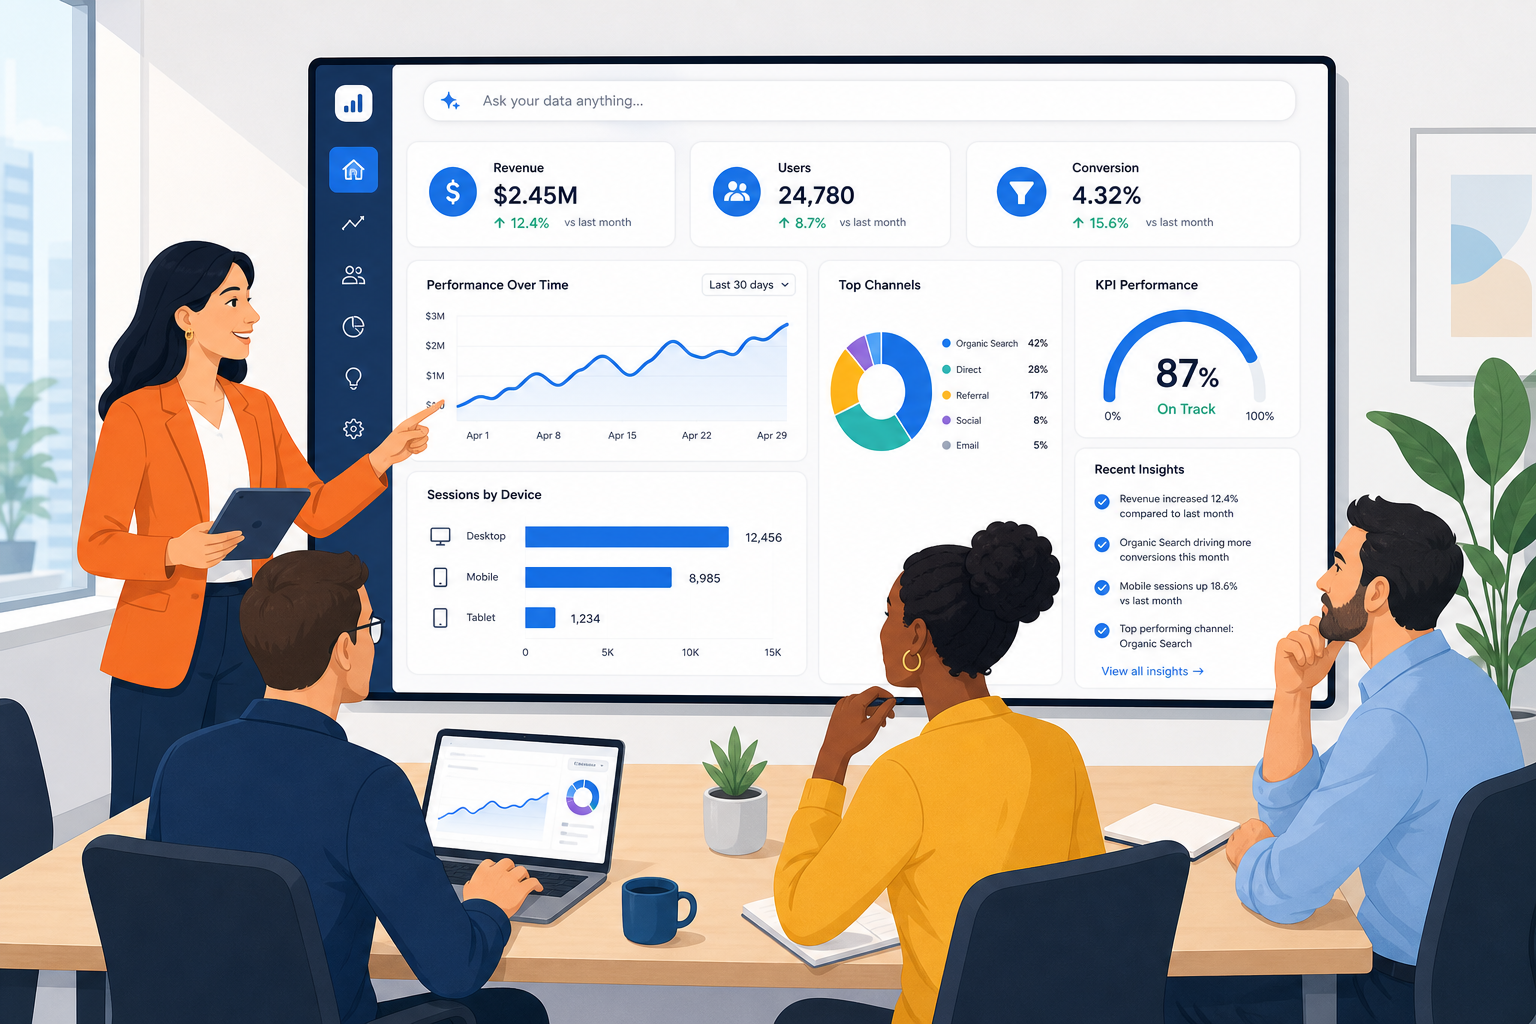
See what's happening in the business — without building a BI stack.
Business intelligence, KPI scorecards, trend analysis, and specialized modules for competitor intel, customer 360, sentiment, and pricing — each with guided workflows and AI-written insights on every chart.
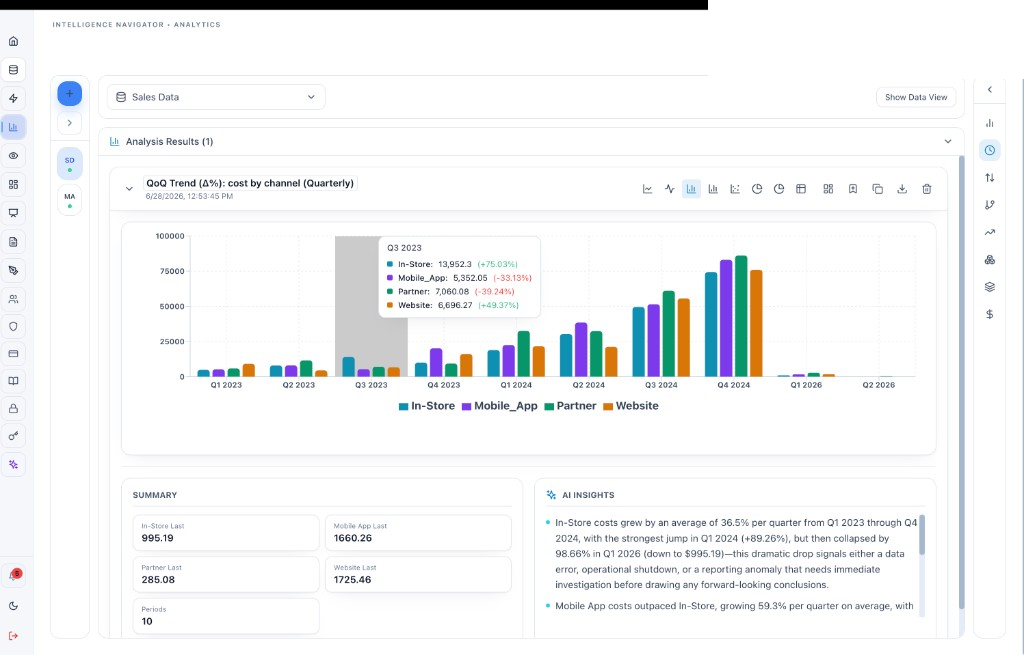
Explore trends and segments.
Line, bar, area, and scatter views on the columns you map — switch chart types and break performance down by region, product, or cohort.
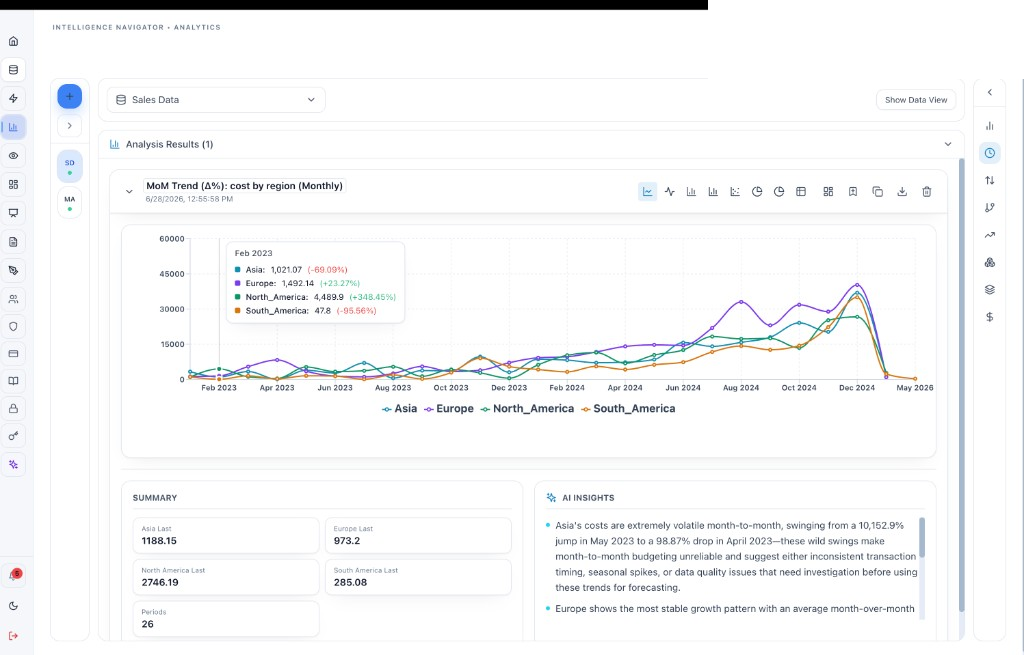
KPI scorecards with period comparisons.
Track revenue, margin, churn, and custom metrics in one view — with WoW, MoM, and YoY overlays and presentation-ready readouts.
AI summaries on every view.
Plain-English bullets explain trend direction, risks, and what deserves attention — so you investigate causes, not just symptoms.
Specialized intelligence modules.
Competitor dossiers, customer 360 profiles, sentiment scoring, and pricing elasticity — dedicated analyses with their own workflows, not a one-size chat prompt.

Plan ahead with forecasts — not gut feel.
Project revenue, demand, costs, or any metric with a date column. Get confidence ranges and written takeaways leadership can use in planning conversations.
Forecast from your own history.
Map a date column and any numeric KPI — trend and seasonality modeled from the data you already have.
Ranges, not false precision.
Upper and lower bounds ship with every projection — so you plan with uncertainty in view.
Headline stats automatically.
Total, average, peak, and trend direction on every run — the numbers executives expect in a review.
Pin to dashboards and decks.
Add projection charts to your workspace and presentations — revisit the same run from analysis history.
Vertex IQ · Knowledge assistant
Prompt
Add agentic AI when you want plain-English access — on top of your analytics.
Conversational agents, scheduled workflows, and proactive monitors complement the dedicated analytics modules — they do not replace BI, KPI, or forecast workflows.
Data IQ — chat over live datasets.
Where conversational access fits, ask how profit trends or which segment leads and get chart-backed answers — optional on top of module-based analysis.
Vertex IQ — cited document answers.
Policy, product, and how-to questions trace to real sources your team can verify — for knowledge that lives outside your datasets.
Scheduled workflows and monitors.
Promote analyses to weekly Slack or email delivery, or describe a monitor in plain English and get diagnosis when thresholds breach.
Deploy to Slack or your site.
Embed assistants for internal self-serve or customer-facing support — separate from the module toolkit your analysts use day to day.
Need a specific capability? AnalyticsAutomationVision AISecurityAll modules
Security
Your data, secured by default.
01
Encrypted at every layer
AES-256 at rest. TLS in transit on every hop.
02
Multi-tenant isolation
Your workspace is fenced from every other customer at the database boundary.
03
Strong authentication
Bcrypt, brute-force lockout, optional 2FA, HttpOnly cookies. SSO for Enterprise.
04
Card data never touches us
Stripe handles every payment. PCI scope stays with the processor.
05
Signed webhooks only
Every inbound integration is cryptographically signature-verified.
06
Your data, on your terms
Export anytime. Delete on request. Never auto-deleted on cancel.
What people are saying on LinkedIn
Recent conversations around Intelligence Navigator point to a clear market need: SMBs have more data than ever, but most do not have the time, tools, or analytics team to turn that data into decisions.
Across LinkedIn discussions, a few themes keep coming up:
SMBs want analytics without complexity
Business owners want answers, not another technical dashboard project.
“The real win isn't replacing analysts — it's giving smaller teams access to capabilities that used to require an entire data department.”
Built for owners and teams without a dedicated analytics department.
Connect your data, run the analyses your business needs — BI, KPI, forecast, and specialized modules — then share dashboards, reports, and decks. Add agentic AI when plain-English access helps.
Try Intelligence NavigatorCustomer testimonial
“Small and mid-sized businesses have never really had access to this kind of thing without hiring for it. Now you mostly just need your data in one place and a willingness to ask it questions.”
Nathan Hirsch
Founder, FreeUp
Start turning your data into decisions today
Connect a spreadsheet or your tools, run your first analysis, and share a dashboard or report in minutes — free to start, no analyst required.
- Free forever plan
- BI, KPI, forecast & specialized analytics
- Dashboards, reports & agentic AI
Create your free account
Free forever · No credit card required
Already have an account? Log in